Monitoring GitHub releases with Prometheus
I have written some exporters to observe things on GitHub. This is how and why. We will talk …

I live in Brazil, and, if you’re not familiar, internet usually sucks here.
I’m one of the lucky few that can afford a good internet, aka 1gbps.
But, I’m not used to trust telecom companies, so I measure my internet speed every 30m and store the results in a time-series database. This is how I did it.
Because reasons, I have a k3s clusters running with 2 Raspberry Pis at home, both connected with cables instead of wifi:
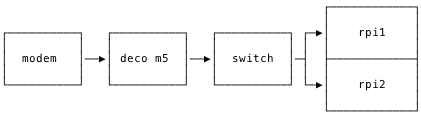
Relevant part of the network.
In any case, I run quite a bit of stuff there, but the important parts for this post are:
You can see all my terraform code for it in this repository.
Assuming you have Prometheus already running (if you don’t, you can install them using their Helm charts), running the exporter is quite easy as well:
apiVersion: apps/v1
kind: Deployment
metadata:
  labels:
    app: speedtest-exporter
  name: speedtest-exporter
  namespace: prometheus
spec:
  selector:
    matchLabels:
      app: speedtest-exporter
  template:
    metadata:
      labels:
        app: speedtest-exporter
    spec:
      containers:
      - name: exporter
        image: ghcr.io/caarlos0/speedtest-exporter:v1.0.0
        ports:
        - containerPort: 9876
          protocol: TCP
        livenessProbe:
          httpGet:
            path: /
            port: 9876
        readinessProbe:
          httpGet:
            path: /
            port: 9876
And
apiVersion: v1
kind: Service
metadata:
  annotations:
    prometheus.io/path: /metrics
    prometheus.io/port: "9876"
    prometheus.io/scrape: "true"
  labels:
    app: speedtest-exporter
  name: speedtest-exporter
  namespace: prometheus
spec:
  ports:
  - port: 9876
    protocol: TCP
    targetPort: 9876
  selector:
    app: speedtest-exporter
  type: ClusterIP
The annotations on the service will be picked up by Prometheus, and it will start collecting the /metrics endpoint of the exporter right away.
Ater testing a couple of already existing exporters, and disliking all of them for several different reasons, I decided to write one myself.
The implementation is basically:
speedtest-cli with the needed flagsWith that, I get a fresh Speedtest result every N minutes, and can graph them with Grafana.
Once the metrics are there, making a dashboard on my Grafana instance was a piece of cake.
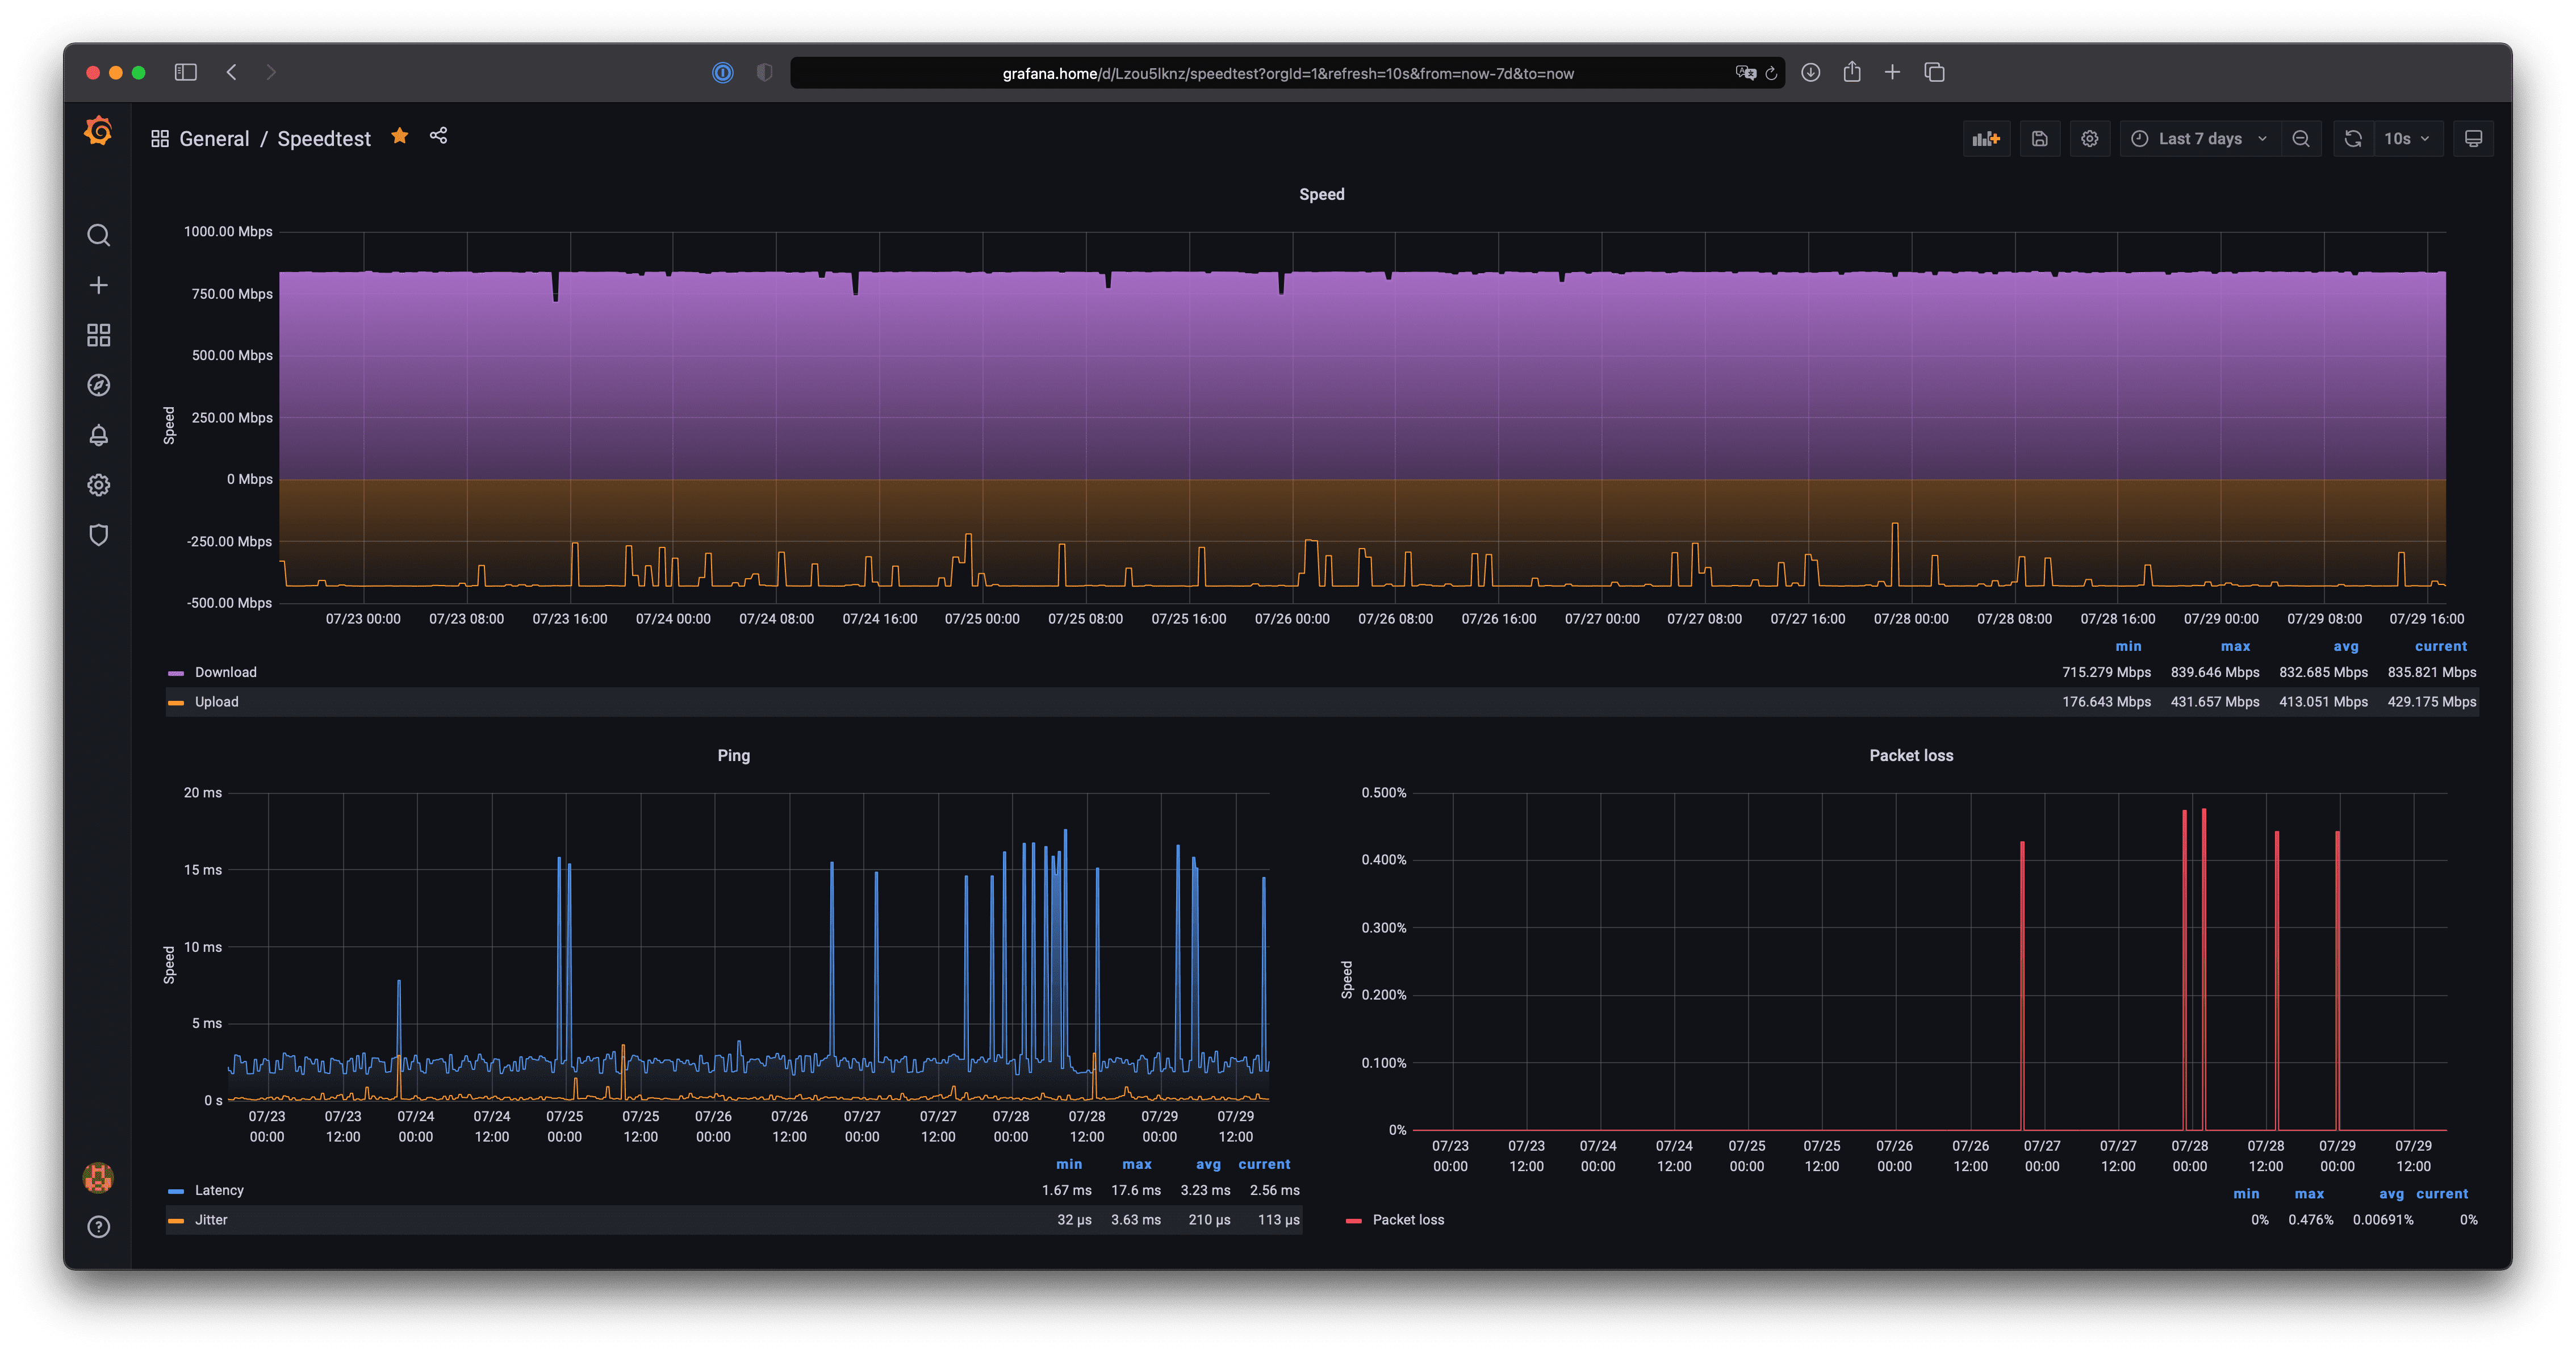
My internet speed in the last 7 days.
You can import it in your own Grafana by informing the ID 14187 or following the instructions here.
As you can see, they are not delivering the promised speeds, so I’ll have to give them a call so they can tell me to restart my modem a couple of times and then “send an update to my modem” or something like that.
That being said, it useful to have a graph like this so I can see its not something intermittent or related to “high demand of business hours”, since we can clearly see its at ~850mpbs all the time, and bringing this kind of data when arguing with the providers sure helps.
I hope this can be somewhat useful for you as well.