Distributed Locking with Redis
At ContaAzul, we have several old pieces of code that are still running in production. We are …

Microservices is the new fancy way of doing applications. Yet, most companies still have big and old monoliths in production. In fast evolving software of this size, it’s usual to have lines of code which are never executed in production. Production code coverage reports can help us find those lines.
The strategy described here can be used in virtually any Java software, but what led me to do this was the difficulty to find code that was not being used in a monolith.
The monolith in question here is ContaAzul. It started as a Struts2 application and evolved to a Java EE application, but still has Struts2 code running in it. You can check these slides by @Marcos to get an idea on how it evolved.
According to cloc, it has ~5k Java files, summing ~400k lines of code. That’s a lot of code and I’m not even counting other kinds of source files (like SQL, templates, etc).
In an attempt to remove useless Java code, I had the idea of running the JaCoCo agent in production server for a while to generate the coverage reports.
JaCoCo stands for “Java Code Coverage”. It is usually used to measure code covered by unit tests.
It is an agent that you pass to the java command in the javaagent flag. It instruments the bytecode and generates a binary report file. Having the source and binary report files, you can generate
human readable HTML reports .
At the build phase, Maven plugins usually does all this work for us. But I don’t want the test coverage, I want production coverage. So, I need to add the JaCoCo agent to a production server to instrument production code.
We don’t use Maven in production, so I had to put the agent to run myself.
We use Puppet to manage our servers configuration. So, I wrote a manifest that would download and instrument our Wildfly application server if a coverage tag was set on the target node:
$jacoco_version='0.7.9'

if tagged('coverage') {
  exec { 'download-jacoco':
    command => "/usr/bin/curl -L -o /storage/environment/jacoco-${jacoco_version}.zip https://repo1.maven.org/maven2/org/jacoco/jacoco/${jacoco_version}/jacoco-${jacoco_version}.zip",
    creates => "/storage/environment/jacoco-${jacoco_version}.zip",
  }~>
  exec { 'unzip-jacoco':
    command     => "/usr/bin/unzip /storage/environment/jacoco-${jacoco_version}.zip -d /storage/environment/jacoco",
    refreshonly => true,
    creates     => '/storage/environment/jacoco',
  }
  file_line { 'jacoco_java_opts':
    path => '/storage/environment/contaazul/bin/standalone.conf',
    line => 'JAVA_OPTS="$JAVA_OPTS -javaagent:/storage/environment/jacoco/lib/jacocoagent.jar=destfile=/storage/environment/contaazul/jacoco.exec,output=file,append=true,dumponexit=true"',
  }
}
With that in place, I could tag the nodes that I want coverage reports for:
node api {
  tag('coverage')
}
But running JaCoCo is only part of the problem. We also need to gather the binary files and generate the HTML reports from them.
The first step is to get the report from the server. The most straightforward way to do that is to use scp and that was what I did.
scp theserver:/storage/environment/contaazul/jacoco.exec .
Then, I downloaded and extracted JaCoCo to my /tmp folder:
$ wget https://repo1.maven.org/maven2/org/jacoco/jacoco/0.7.9/jacoco-0.7.9.zip -O /tmp/jacoco.zip
$ unzip /tmp/jacoco.zip -d /tmp/jacoco
With all that in place, I wrote a very simple Ant task to generate the HTML reports:
<project name="ContaAzul" xmlns:jacoco="antlib:org.jacoco.ant">
    <taskdef uri="antlib:org.jacoco.ant" resource="org/jacoco/ant/antlib.xml">
        <classpath path="/tmp/jacoco/lib/jacocoant.jar"/>
    </taskdef>
    <jacoco:report>
        <executiondata>
            <file file="jacoco.exec"/>
        </executiondata>
        <structure name="ContaAzul">
            <classfiles>
                <dirset dir="." includes="**/target/classes"/>
            </classfiles>
            <sourcefiles encoding="UTF-8">
                <dirset dir="." includes="**/src/main/java"/>
            </sourcefiles>
        </structure>
        <html destdir="report"/>
    </jacoco:report>
</project>
Then, fire ant up and open the report in your web browser:
$ ant
$ open report/index.html
You should see a report like this (this is a fake one):
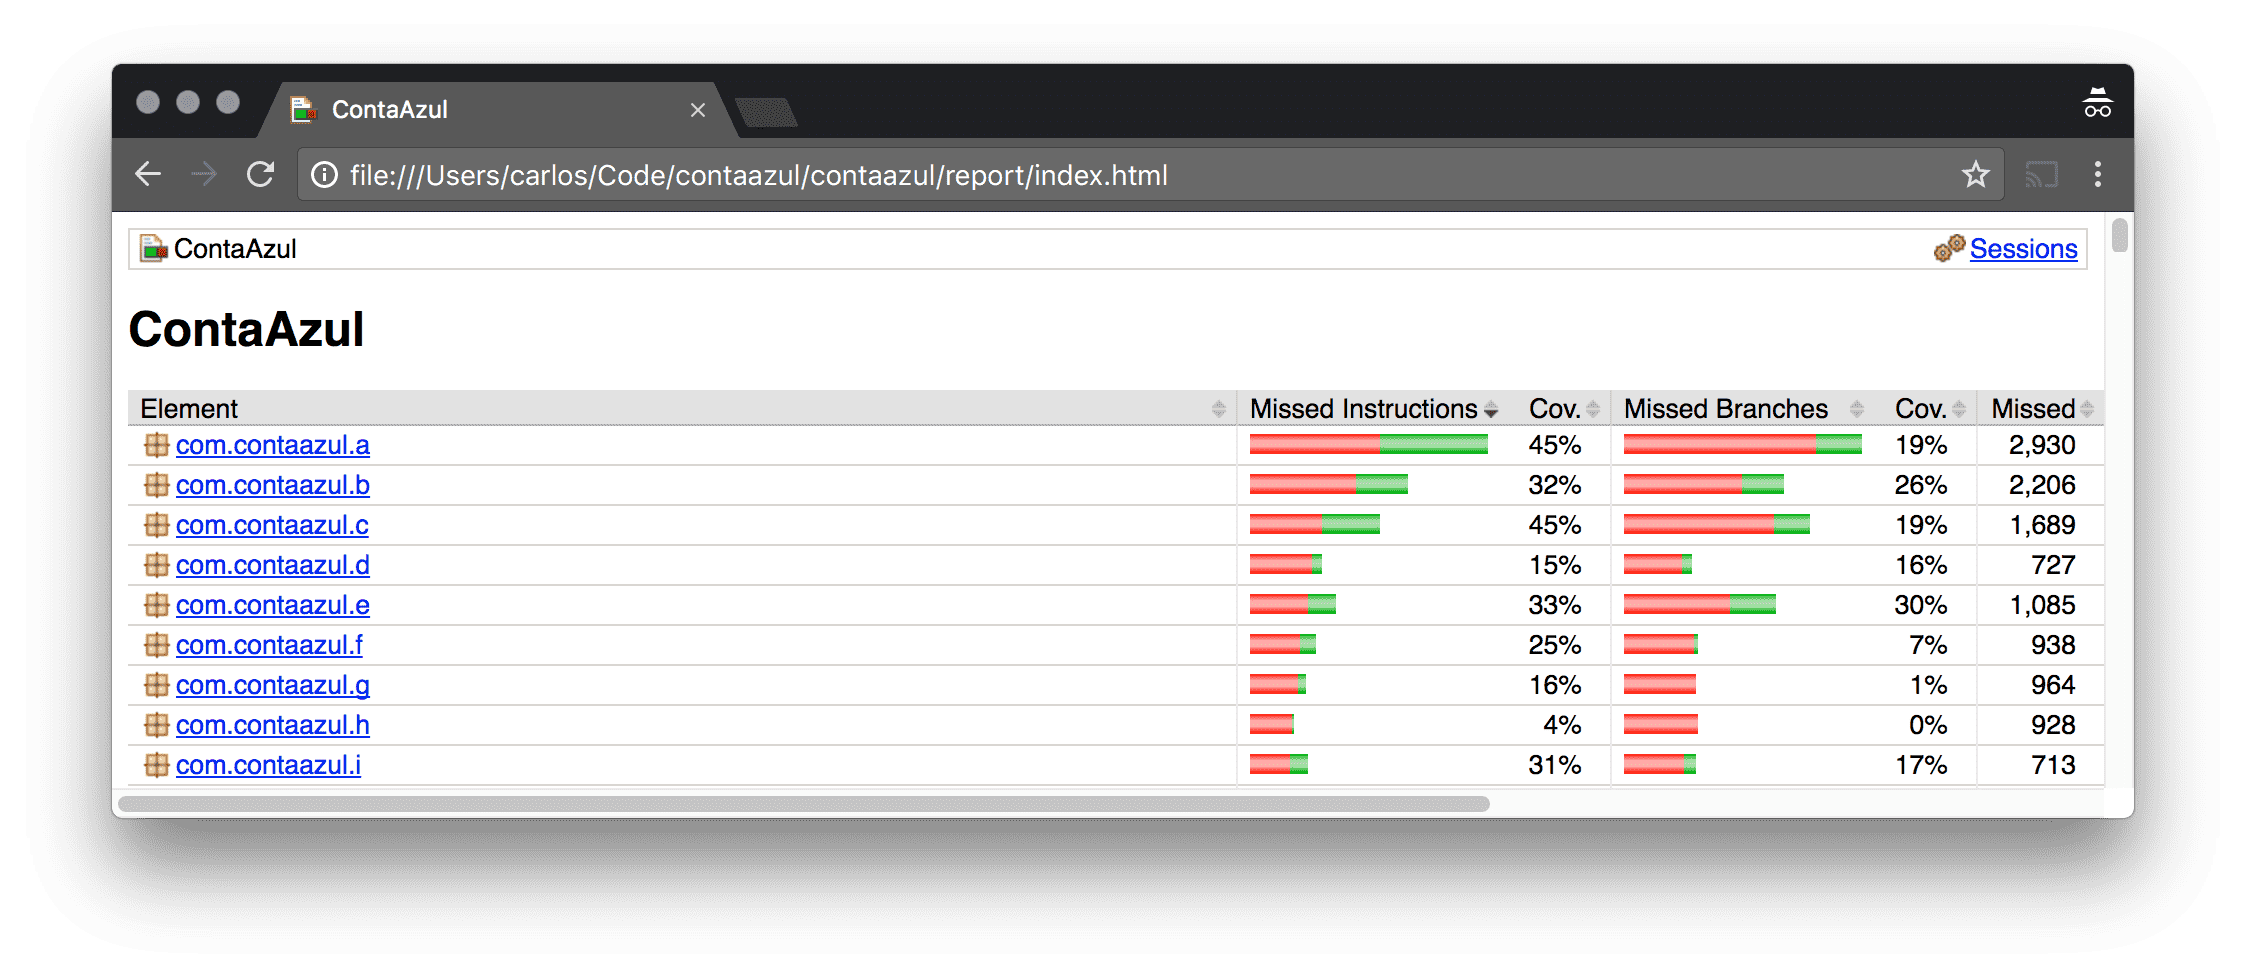
Coverage of several packages
ProTip™: if the Ant task fails, try to run it with -v for a more verbose output.
At this point I wanted to automate it all to get daily reports (or something like that).
After giving it some thought, I decided that it wouldn’t worth it. The reasoning behind this decision was:
I’m also aware that running it this way have its own setbacks:
Anyway, with all this code in place it’s kind of easy to run it for a while in a server and generate the reports later.
Having this coverage report is not a free pass to set on fire code that shows up in it. It’s more like an inspirational map of things that we can remove. Using it as map, the team was able to open ~20 pull requests which removed ~5k lines of useless code in a very short time.
I’m happy with this result and looking forward to generate more reports and remove even more code.